Announcing the Upcoming Launch of Optix 2
As we refine the eagerly awaited first release of Optix 2, we’re excited to offer you a sneak peek into its remarkable capabilities, fully optimised for both desktop and tablet.
To give you a taste of what’s on the horizon and to showcase some of the initial features of Optix 2, we invite you to watch the preview video.
Stay tuned for more updates as we approach the official launch of Optix 2 this summer.
Optix Features
Built with our users and their patients in mind.
We’ve been working for over 20 years to create a solution with everything you could ever need to run your optical or audiology practice. Whether it’s the day to day running of your business or helping you to achieve performance and growth goals – we’ve got you covered.
We have all the features you’d expect in a PMS. From diary administration, staff permissions, stock management, clinical integrations and patient records. There’s too many to mention!
Then there’s the exciting features that help take your business to the next level. We’re talking about things like a fully integrated eGOS process, the ability to collect reviews and your Net Promoter Score from patients, real-time online booking for your patients and an impressive Business Intelligence suite with performance insights to help you focus and grow your business.
We’ve showcased some of the features we’re most proud of below, or you can skip to a summary of all our features.
Always giving you more
Regular Updates
At our offices in York, our team are always busy working on new and exciting things for our users. We work with pilot sites to get feedback and to make sure everything is working exactly how we want before we roll it out. All updates are included in your monthly rental too!
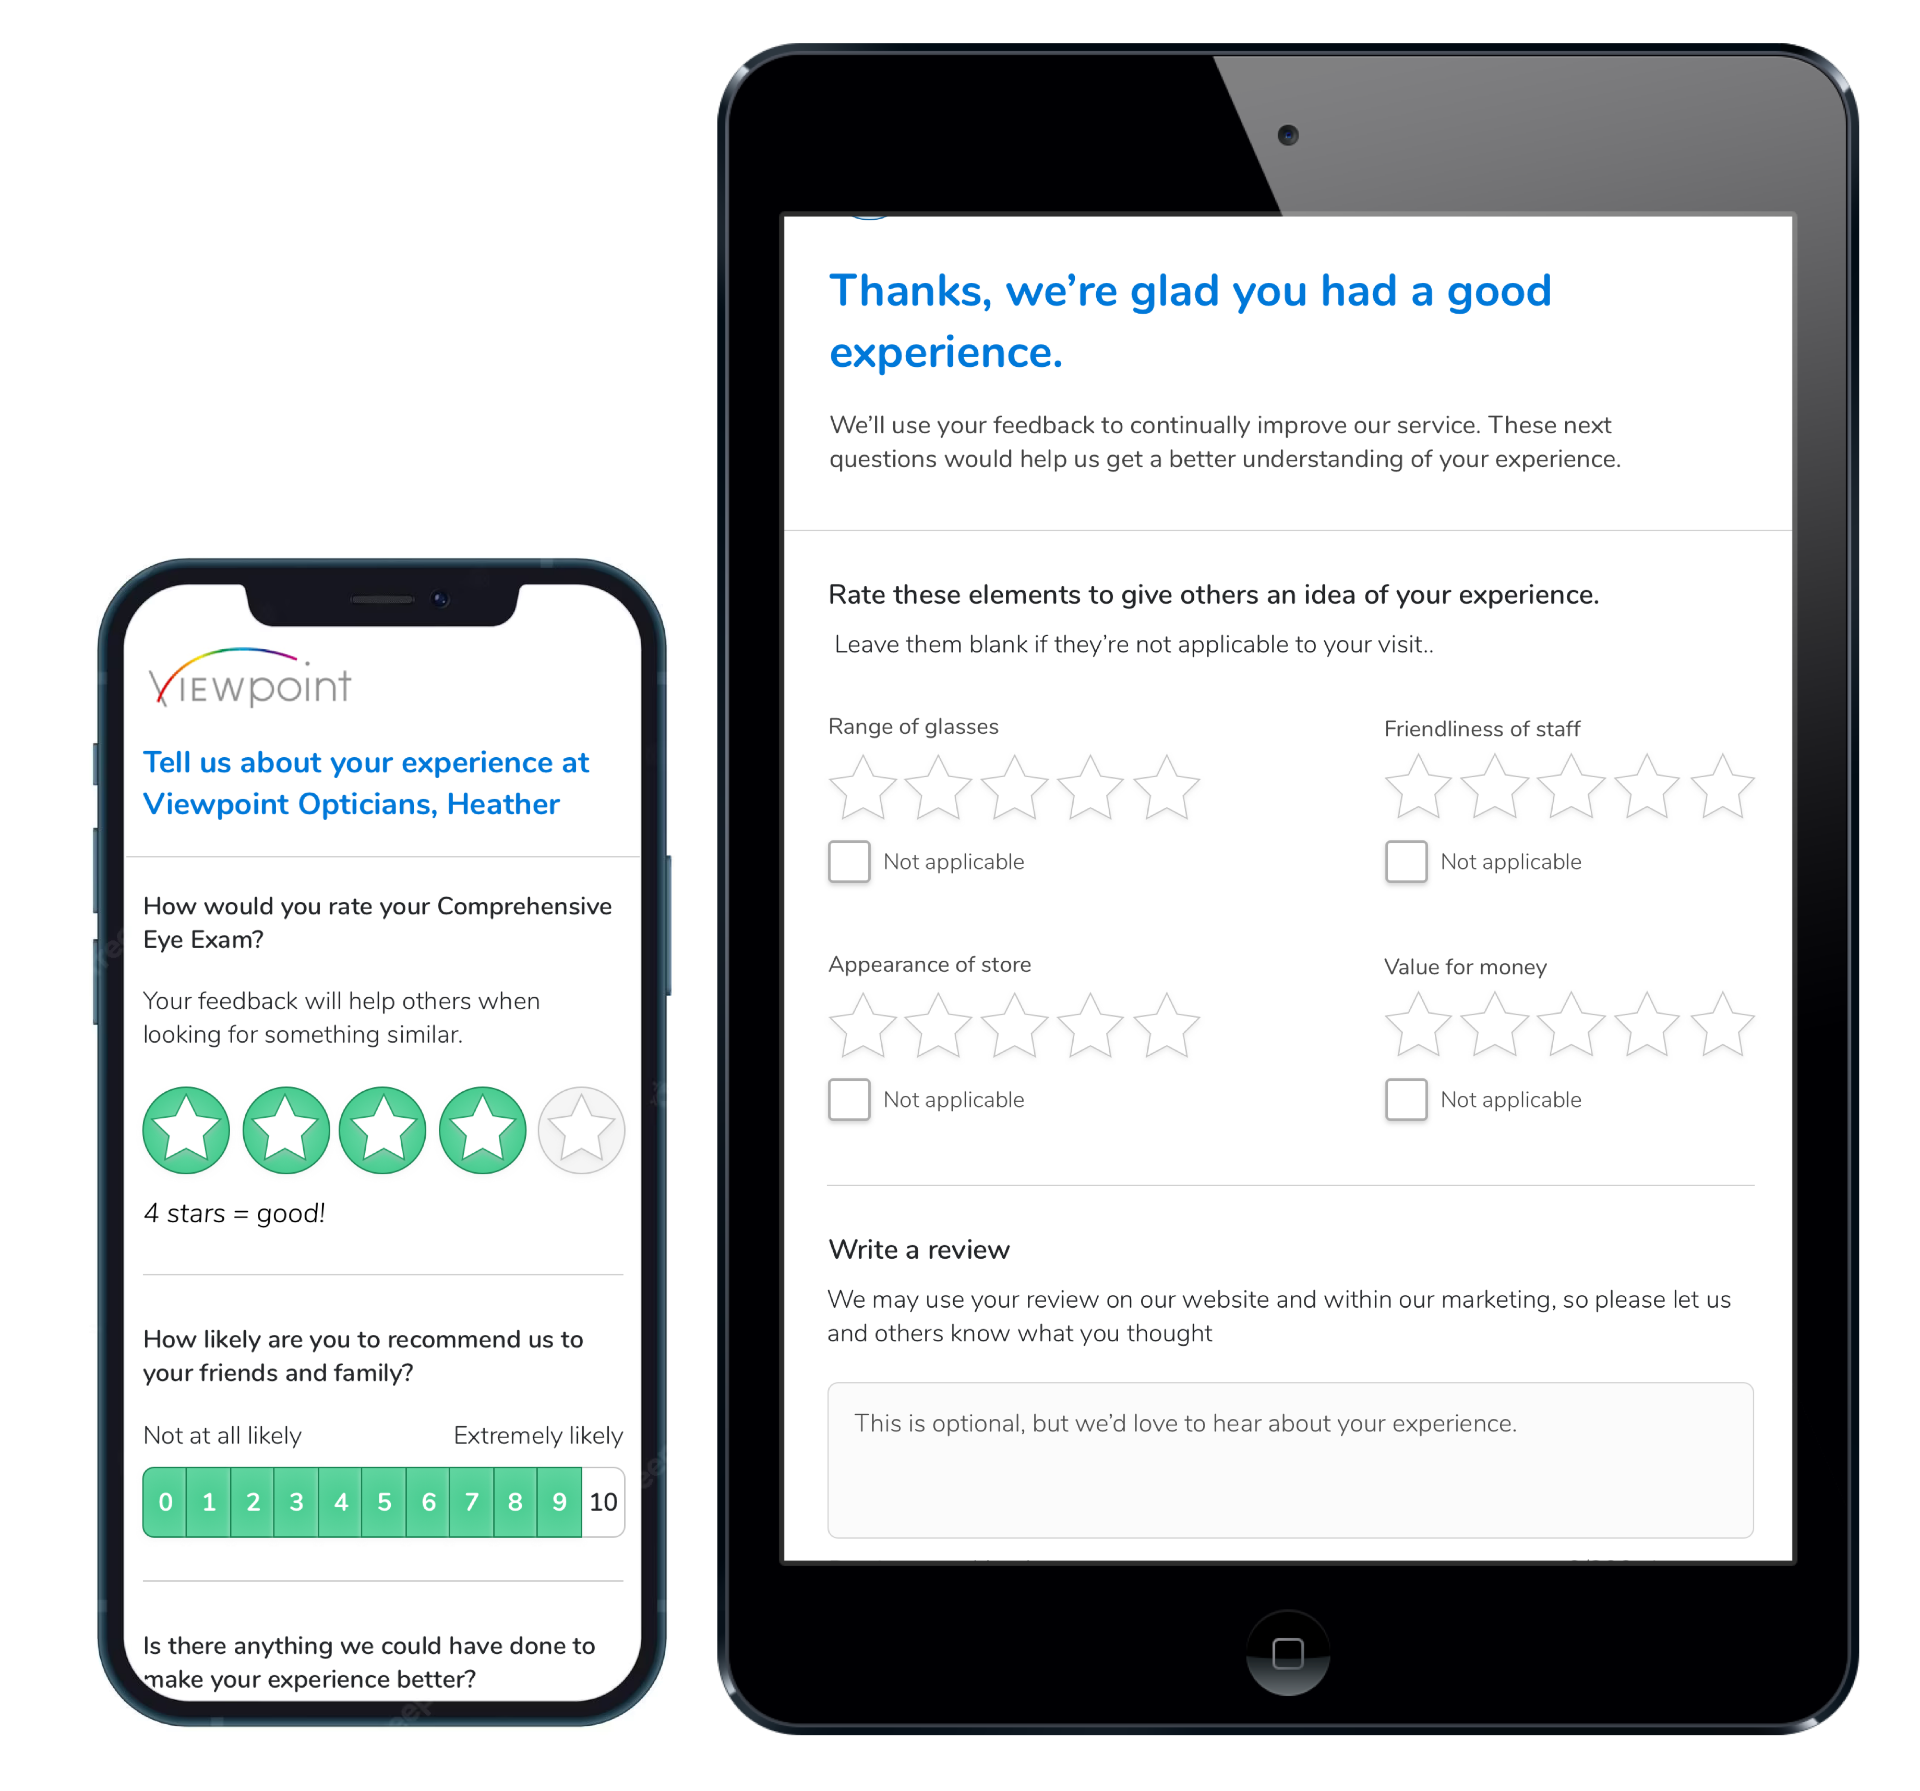
Get reviews and measure your Net Promoter Score
Send out automated requests for reviews based on rules defined by you. Qualifying patients will receive an email asking for a star rating and feedback on their experience with you.
- Display your reviews on your website using one of APIs. You can easily query your latest reviews to attract and reassure new patients on your website.
- Your rolling 30 or 90 day Net Promoter Score is displayed in your Optix diary. We’ve seen first hand how this motivates staff to make sure every experience is a great one.


Mysight
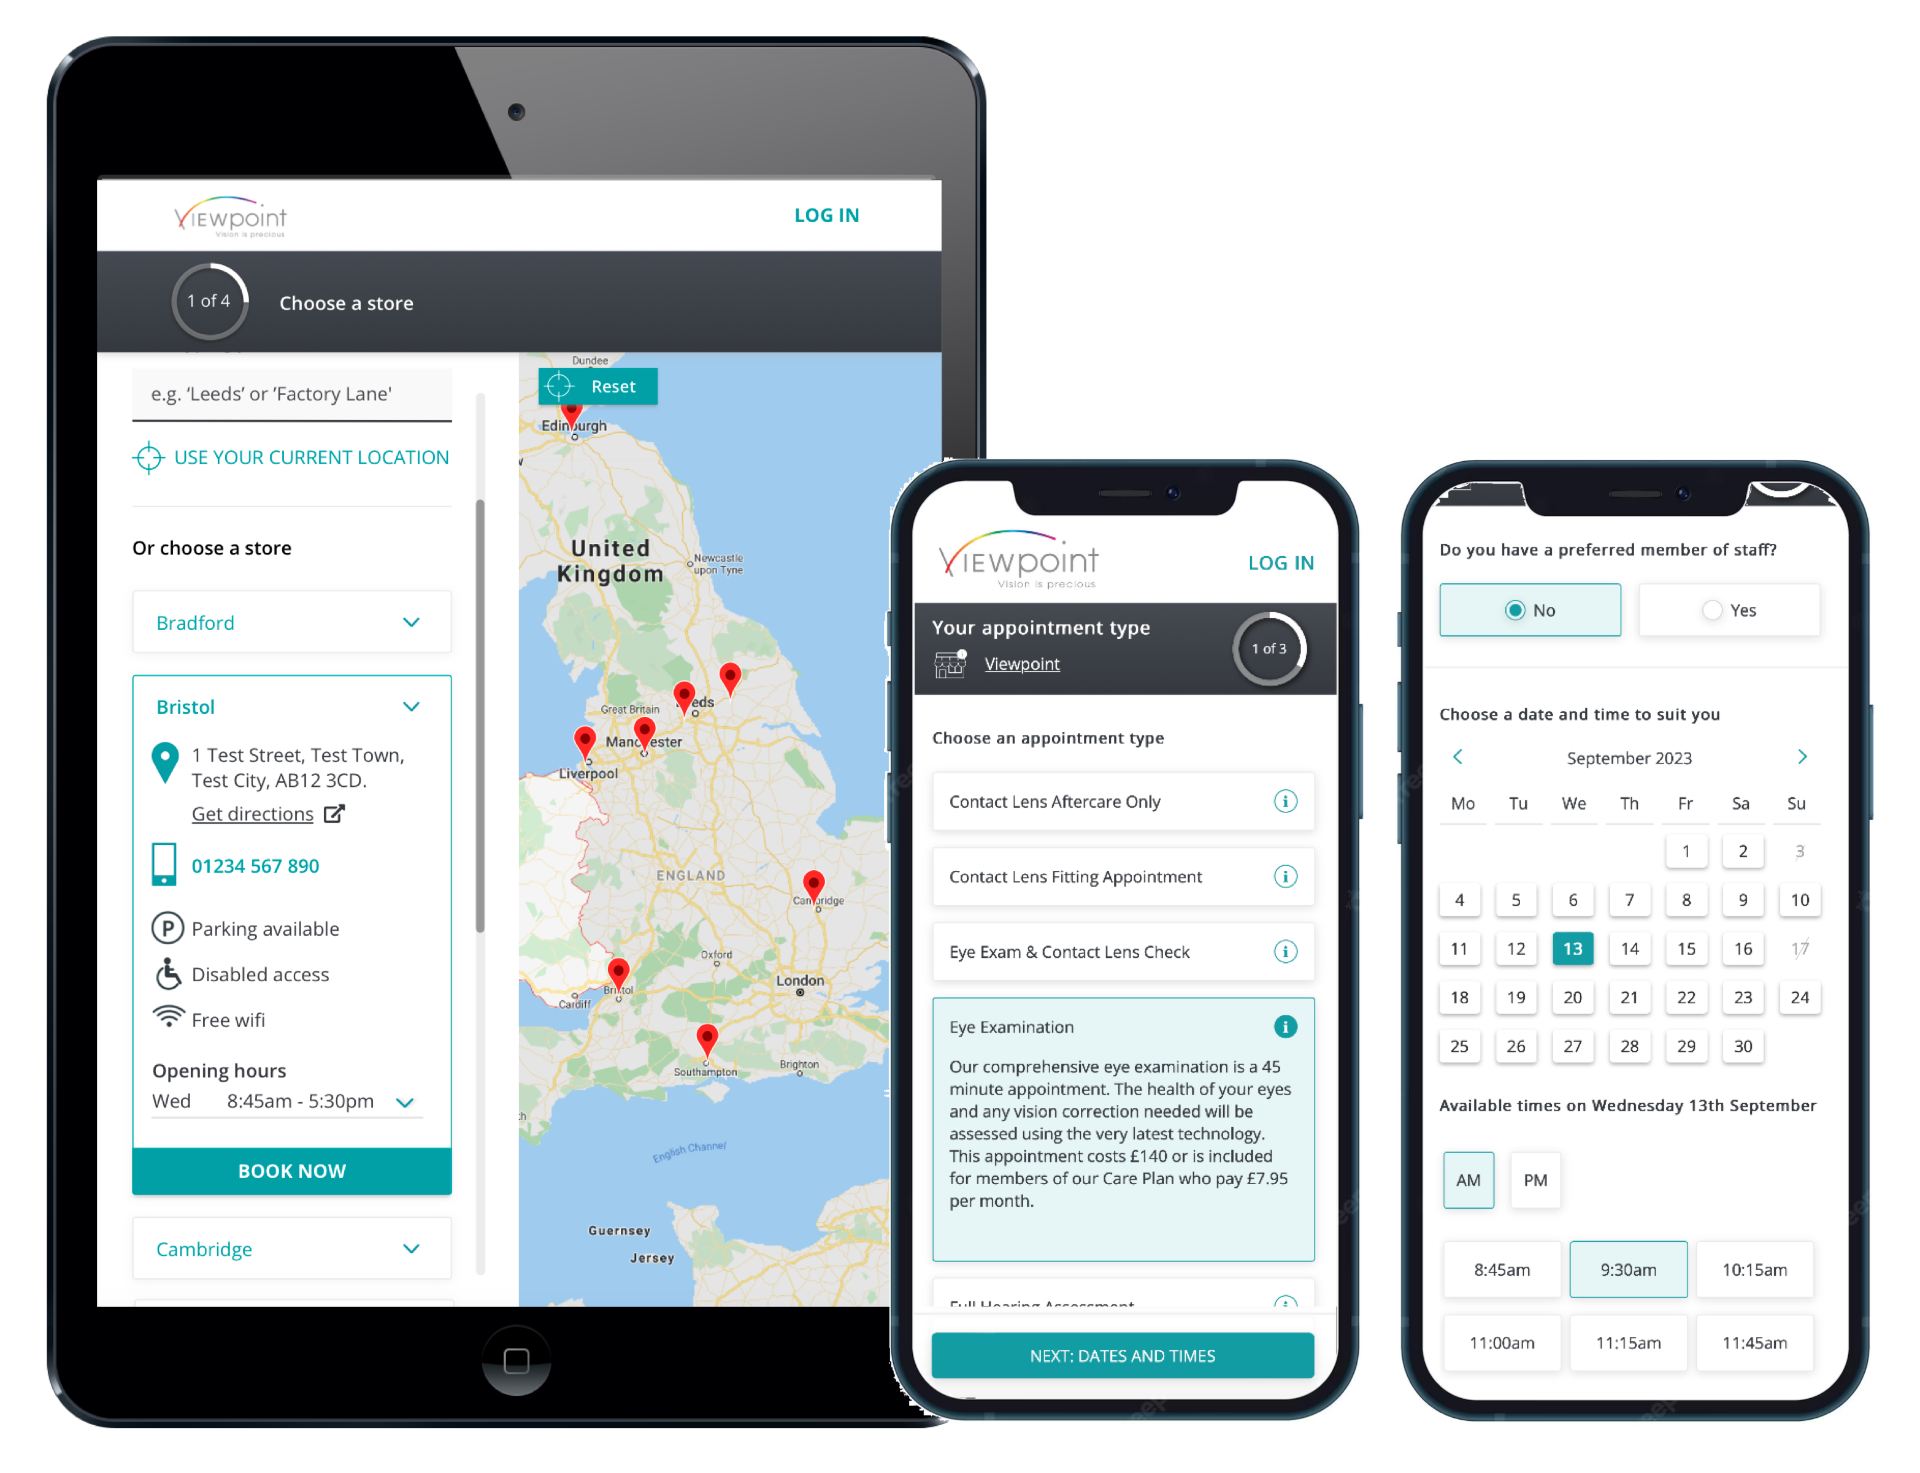
Real-time online booking
We know that patients want to make appointments at a time to suit them. Use our MySight booking platform to let new and existing patients browse your locations, appointment types and available slots and make a booking.
Optix lets you configure what days, times and appointment types you offer online, so you’re always in control of your diary.
Patients create an online account as part of their booking process, which allows them to manage their appointments and keep their details up to date.
Optix allows you to multi-task
Our experience of a busy practice meant we needed to find a way to let our users easily switch between functions and patient records, without having to close down what you’re working on.
- Have your diary, multiple patient records and other functions open simultaneously so you can be working on more than one thing at a time.
- Great for busy practices where you’ve got multiple patients in the practice at the same time. You can keep these records open while still having access to your diary and any other functions you need.
- Easily see which patients and functions have unsaved changes for easy management.

Taking the hassle out of eGOS
Effortlessly simplify eGOS processes with our streamlined solution, eliminating the hassle for a seamless experience.
-
The patient’s journey is fully integrated with our eGOS functionality.
- Capture signatures in real-time directly on a tablet for a convenient and efficient solution
- Efficiently manage and reconcile your eGOS voucher submissions
Too many features to name
Optix Features at a Glance
When it comes to tools needed to run your business, we really have thought of everything. We’ve listed some of our features and functionality below, but to get a real sense of how Optix could work for your business, why not request a demo or contact us if you have a question?
DIARY
Quickly find and schedule appointments with multiple views. Your diary is fully integrated with MySight, your online booking platform, and recall reminders.

direct debits
Easily set up and manage pay monthly plans for your patients. Real time bank checks and automated processes make this easy to manage.

Recall & Marketing
Use automated recall groups to notify patients they’re due in practice, or run a marketing query for something specific. Choose between email, SMS, letters and Postcards.

Business Intelligence
A wealth of data at your fingertips. Use our scorecard to track your KPIs, or look at ways to grow your business using our insights and reports.

STOCK
Easily manage your stock and make stocktakes a breeze with our stocktake app which runs on a mobile device and feeds directly into Optix.

CLINICAL
Unlock the full potential of our comprehensive Clinical modules, allowing you to record detailed information and results throughout the entire eye examination process, seamlessly encompassing contact lens fittings and aftercare services.

eGOS
Effortlessly simplify eGOS processes with our streamlined solution, eliminating the hassle for a seamless experience.

ADMIN
Quickly manage centralised staff permissions, settings, templates, pricing and much more with ease.

hub
Experience the convenience of our web-based platform, empowering you to download, price, and efficiently manage your product catalogue, all within the Optix system.
First Class Functionality
With customer support to match
Your monthly rental includes access to our team of experts based in York, because we want you to get the most out of Optix. We’ll work with you to make sure Optix is working for you and your business.
we've branched out
Audix
All the same great features, now for Audiology!
Seamlessly manage your Optical and Audiology businesses to provide even more value to your patients.
We've worked with a group of Audiologists to create easy to use and simple clinical procedures and hearing instrument recommendations.

Keep things simple
Benefits of Optix
Customise to suit your business
Use group and branch level configurations and settings to make things easy to manage, no matter the size of your business.
ISO 27001 Certification
Optix was the first UK PMS provider to be accredited with ISO 27001 certification, we’re committed to maintaining the highest standards of information security.
We can be your IT partner
From Optix support to helping you with any IT issues, we’re your go-to resource for comprehensive assistance.
Integrate with Optix
We’re building a collection of APIs for our users. These are particularly powerful if you have a development team or want to use external tools where access to the data in Optix is needed.